
| Version 2 (modified by , 6 years ago) (diff) |
|---|
Inspecting the GC heap
What is the GC Heap?
The GC ("Garbage Collection") heap is the set of objects whose lifetimes are managed by the JavaScript Garbage Collector. JavaScript does not have explicit memory management functions, so JS object lifetimes are managed by garbage collection. This involves traversing the memory used by those objects, looking for memory values that look like pointers, and deducing that objects are live if any pointer-like values refer to them. When an object no longer has any live references, it can be garbage-collected, and then gets actually destroyed.
In the implementation, objects in the GC heap are referenced through JSCell pointers. The heap is managed by JavaScriptCore/heap/Heap.h and the process of visiting the JSCells for the purpose of GC by JavaScriptCore/heap/SlotVisitor.h. Cells that are visited are "marked" to avoid visit cycles.
Some objects in the GC heap are also connected to objects in the C++ native world, for example things like DOM nodes and event handlers that are exposed to script. Their lifetime rules get more complex, and it's often here that bugs creep in.
Why might you want to inspect it?
The primary reason to inspect the GC heap is to get information about why an object is not being destroyed when you think it should be. Often, we see that Document objects stick around longer than we expect (see bug 186214 for more on this). If we capture a GC heap dump at the point where we expect the Document should have been destroyed, we can inspect the output to see what objects reference that Document, thus keeping it alive. We'll work through an example below.
An example
Bug 188728 is a good example; in this case, after running IndexedDB tests, we notice that the Document for the main page is never released. A bit of investigation shows that this can be replicated in MiniBrowser by making a small test change to navigate as soon as the test is complete (see the small test patch). Reproducing in MiniBrowser just makes it a little easier to debug.
Here's how we confirm that we are actually seeing a real problem:
- We start the test server so that the web-platform-test actually works:
./Tools/Scripts/run-webkit-httpd - Now run MiniBrowser and load the test, using the localhost url http://localhost:8800/IndexedDB/value.htm
- The test automatically navigates to about:blank now, but the previous page may still be in the page cache (and referenced by other cached things), so we need to trigger a low memory warning, which will clear those caches. On Apple platforms, we can do that via the
notifyutilutility:notifyutil -p org.WebKit.lowMemory. That clears caches, and triggers a GC. - Now we can see what Documents are still live, again using notifyutil:
notifyutil -p com.apple.WebKit.showAllDocuments. This will dump to the system log (and your Terminal or Xcode, wherever you ran MiniBrowser from). You'll see something like:1 live pages: Page 0x1168fe000 with main document 0x1161bf000 file:///Volumes/Data/Development/apple/webkit/testcontent/simple/A.html 2 live documents: Document 0x11615e000 http://localhost:8800/IndexedDB/value.htm Document 0x1161bf000 about:blank
So that shows us that value.htm is still around, which is bad.
- Now we can dump the GC heap, again with notifyutil:
notifyutil -p com.apple.WebKit.showAllDocuments. This will log something like:Dumped GC heap to /var/folders/bh/34x83y_n4mn5n_nv0v_rdmh80000gn/T/org.webkit.MiniBrowser/GCHeapOayHEu. That's your JSON output, so copy the file somewhere to keep it:mv Dumped GC heap to /var/folders/bh/34x83y_n4mn5n_nv0v_rdmh80000gn/T/org.webkit.MiniBrowser/GCHeapOayHEu ~/Desktop/values-heap.json
- The heap viewer is located in
Tools/GCHeapInspector. I usually fire up a local server to use it:cd Tools/GCHeapInspector python -m SimpleHTTServer 8999
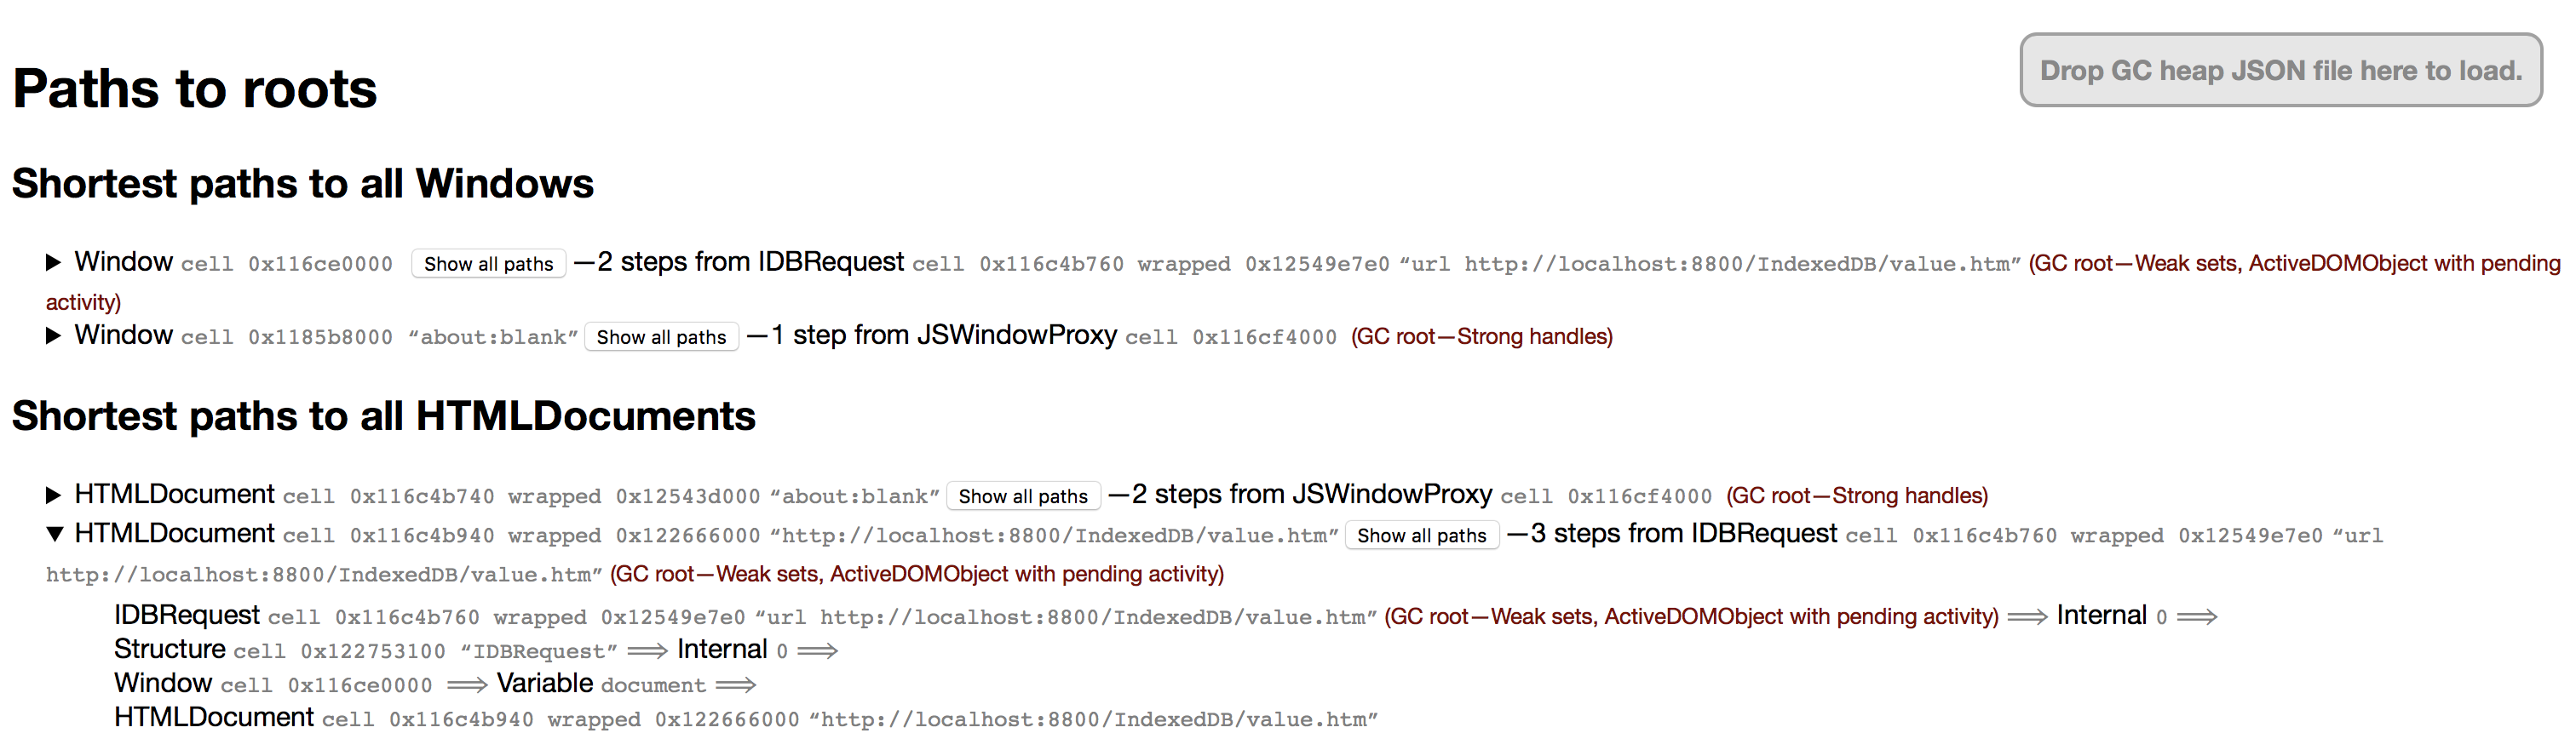
(port 8999 to avoid conflicting with the webkit test localhost ports) - Now in the browser navigate to http://0.0.0.0:8999/gc-heap-inspector.html. You'll see the GC heap inspector banner. Now drag your
~/Desktop/values-heap.jsonfile onto the badge in the top right.
Attachments (1)
-
gc-heap-inspector.png (376.9 KB) - added by 6 years ago.
GC heap inspector screenshot
Download all attachments as: .zip